Original file (1,280 × 863 pixels, file size: 799 KB, MIME type: image/png)
Summary
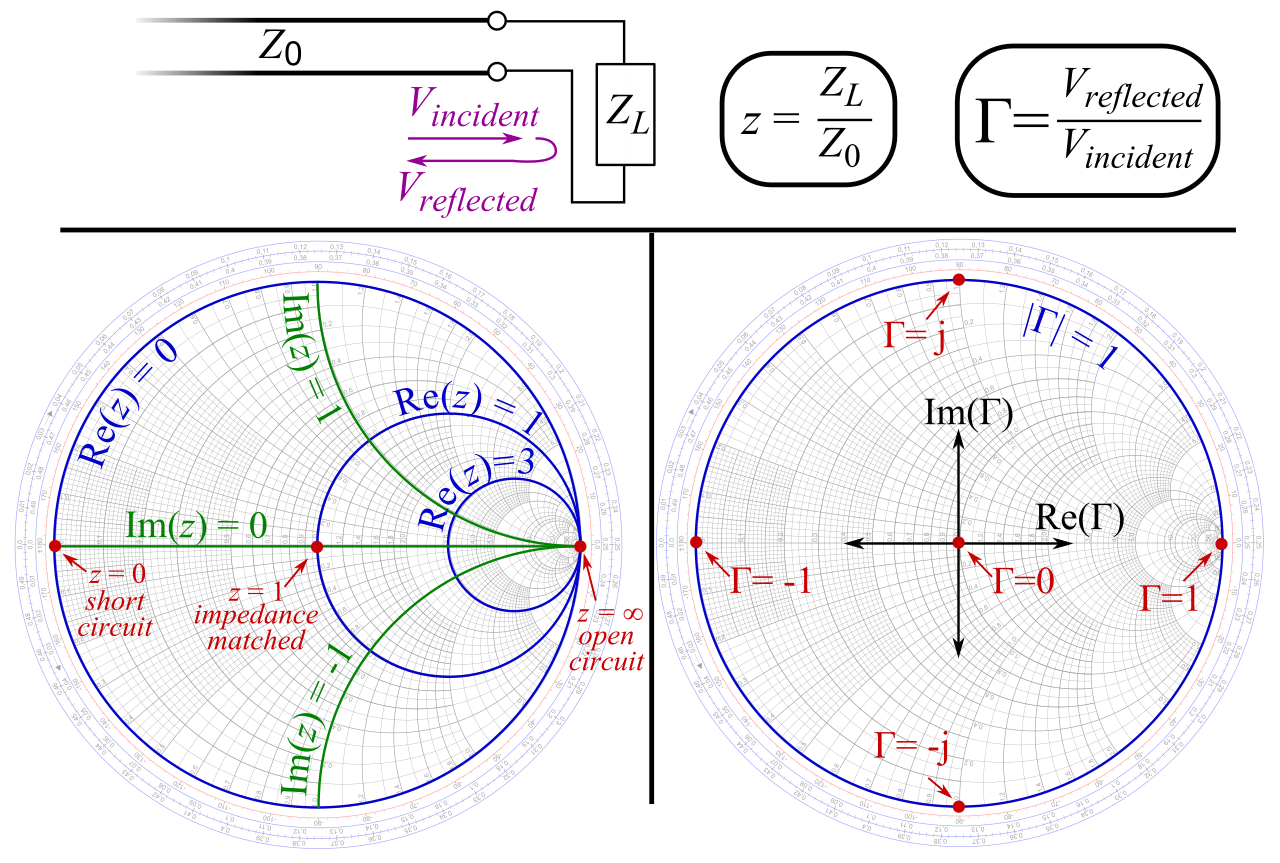
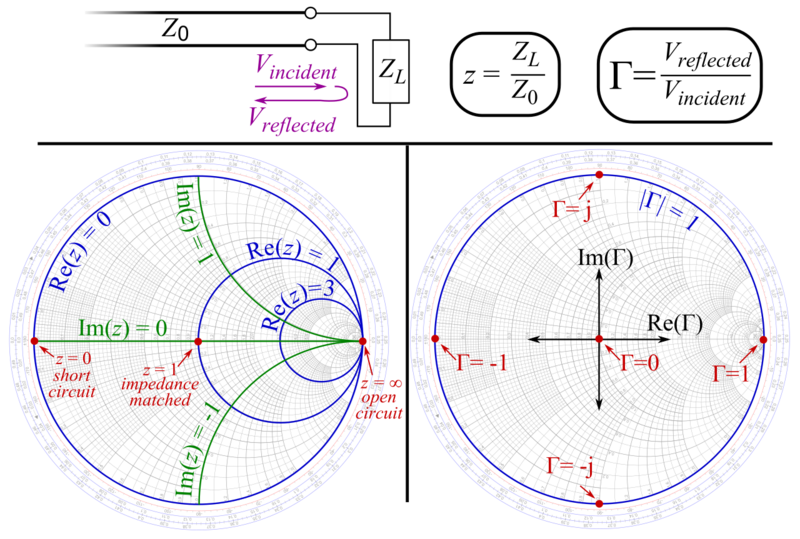
Most basic explanation of the Smith chart. A wave travels down a transmission line of impedance Z0, terminated at a load ZL. The voltage reflection coefficient is Gamma. The normalized impedance is z. Each point on the Smith chart represents a value of z (bottom left), and also represents the corresponding value of Gamma (bottom right). Date 18 July 2012 Source Own work Author Sbyrnes321
I, the copyright holder of this work, hereby publish it under the following license: w:en:Creative Commons attribution share alike This file is licensed under the Creative Commons Attribution-Share Alike 3.0 Unported license. You are free: to share – to copy, distribute and transmit the work to remix – to adapt the work Under the following conditions: attribution – You must give appropriate credit, provide a link to the license, and indicate if changes were made. You may do so in any reasonable manner, but not in any way that suggests the licensor endorses you or your use. share alike – If you remix, transform, or build upon the material, you must distribute your contributions under the same or compatible license as the original.
Licensing
 | Permission is granted to copy, distribute and/or modify this document under the terms of the GNU Free Documentation License, Version 1.2 or any later version published by the Free Software Foundation; with no Invariant Sections, no Front-Cover Texts, and no Back-Cover Texts. |
| If this file is eligible for relicensing, it may also be used under the Creative Commons Attribution-ShareAlike 3.0 license. The relicensing status of this image has not yet been reviewed. You can help. |  |
File history
Click on a date/time to view the file as it appeared at that time.
| Date/Time | Thumbnail | Dimensions | User | Comment | |
|---|---|---|---|---|---|
| current | 15:32, 20 October 2023 | | 1,280 × 863 (799 KB) | Isidore (talk | contribs) | Most basic explanation of the Smith chart. A wave travels down a transmission line of impedance Z0, terminated at a load ZL. The voltage reflection coefficient is Gamma. The normalized impedance is z. Each point on the Smith chart represents a value of z (bottom left), and also represents the corresponding value of Gamma (bottom right). Date 18 July 2012 Source Own work Author Sbyrnes321 I, the copyright holder of this work, hereby publish it under the following license: w:en:Creative Common... |
You cannot overwrite this file.
File usage
The following page uses this file: