
Size of this PNG preview of this SVG file: 800 × 482 pixels. Other resolution: 2,560 × 1,542 pixels.
Original file (SVG file, nominally 800 × 482 pixels, file size: 87 KB)
Summary
Summary
| Description |
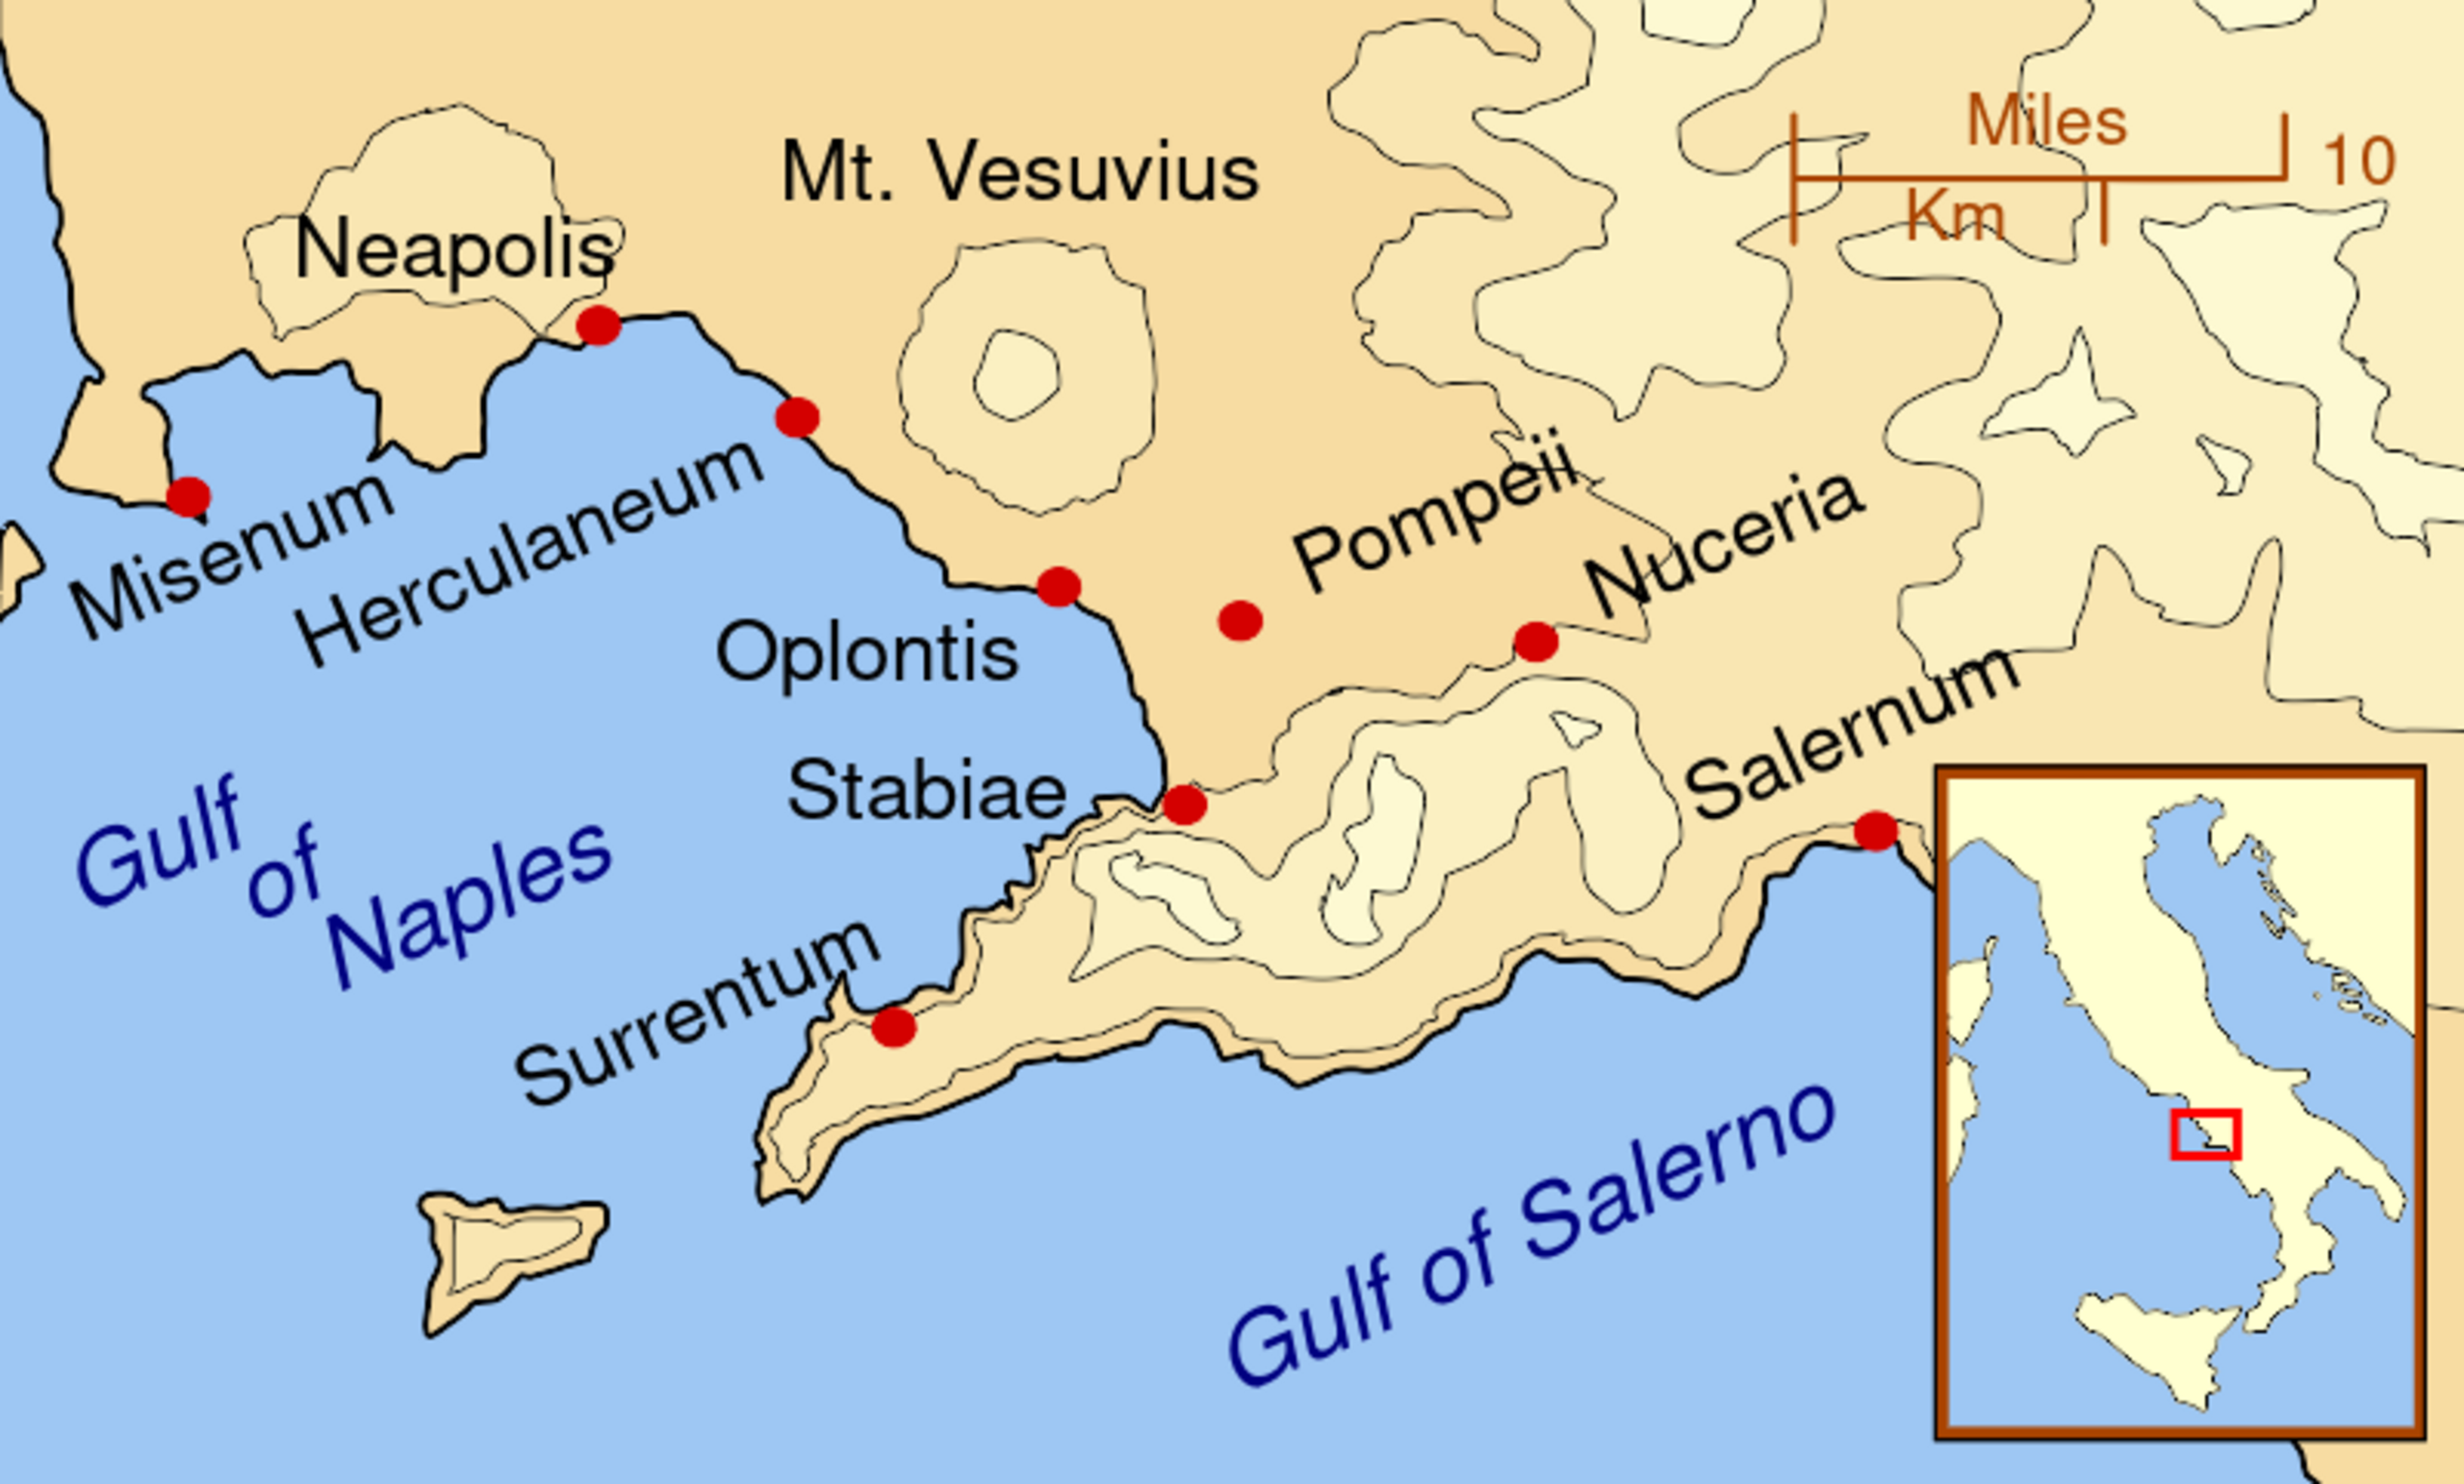
English: A map showing the cities and towns affected by the eruption of Mount Vesuvius in 79 AD. The general shape of the ash and cinder fall (see w:en:pyroclast) is shown by the dark area to the southeast of Mt Vesuvius. (P.S. It seems strange to show the modern day English names for the two bodies of water - I am open to suggestions). This map shows lines and uses the Mercator projection (although that is not important on a map of this scale). North is, as usual, at the top of the map. |
|---|---|
| Source |
Own work |
| Date |
2007-10 |
| Author | |
| Permission (Reusing this file) |
See below. |
| Other versions | Template:Other versions/Mt Vesuvius 79 AD eruption |
Licensing
 | Permission is granted to copy, distribute and/or modify this document under the terms of the GNU Free Documentation License, Version 1.2 or any later version published by the Free Software Foundation; with no Invariant Sections, no Front-Cover Texts, and no Back-Cover Texts. |
| If this file is eligible for relicensing, it may also be used under the Creative Commons Attribution-ShareAlike 3.0 license. The relicensing status of this image has not yet been reviewed. You can help. |  |
File history
Click on a date/time to view the file as it appeared at that time.
| Date/Time | Thumbnail | Dimensions | User | Comment | |
|---|---|---|---|---|---|
| current | 20:16, 15 November 2023 | | 800 × 482 (87 KB) | Isidore (talk | contribs) | == {{int:filedesc}} == {{Information |other versions={{Other versions/Mt Vesuvius 79 AD eruption}} |Description={{en|A map showing the cities and towns affected by the eruption of Mount Vesuvius in 79 AD. The general shape of the ash and cinder fall (see w:en:pyroclast) is shown by the dark area to the southeast of Mt Vesuvius. (P.S. It seems strange to show the modern day English names for the two bodies of water - I am open to suggestions). This map shows lines and uses the Mercat... |
You cannot overwrite this file.
File usage
The following 2 pages use this file: